The March 13, 2026 Midwest Windstorm: A New Framework for Evaluating Power Outage Vulnerability During High Wind Events
April 21, 2026
Dr. Jay Shafer, Chief Innovation Officer, PowerOutage.com
Key Insights
- The March 13, 2026 windstorm brought widespread high winds 50–60 mph with localized record-breaking hurricane-force gusts across the Great Lakes and Midwest.
- Power Outage Impacts: Peak outages reached approximately 1.37 million customers, with the most severe impacts concentrated in Ohio (637,000 customers).
- Elevated Wildfire Risk Scenario: This was a black swan-like event for central and eastern US wildfire risk. Exceptionally dry westerly conditions increased wildfire ignition potential and supported rapid wind-driven fire spread.
- Nonlinear Damage Response and Forecast Sensitivity: Outage impacts increased nonlinearly with wind intensity, illustrating high sensitivity to small forecast errors near the 50–60 mph threshold.
- Unlocking New Geospatial Wind Stress Analytics: A unified geospatial framework that integrates wind intensity, duration, and coverage enables consistent impact quantification across utilities and powers AI-driven benchmarking and predictive insights.
Wind Intensity and Outage Impacts
This report examines the March 13, 2026 windstorm and its relationship between high wind exposure and power outages across the Great Lakes and Midwest. Peak outage impacts reached 1.37 million customers across 8 states, with Ohio (637,000 customers) accounting for over half of peak power outage impacts (Table 1); this was the most customers without power in Ohio going back to at least 2017. This storm system was driven by a mature fast-moving storm system that tracked across the high plains and northern Great Lakes. The storm had a history of producing high and dry westerly winds along its southern flank as it made landfall in the Pacific Northwest and re-intensified in the high Plains.
A notable characteristic was a dry air mass that contributed to efficient vertical mixing, allowing higher-momentum winds aloft to be more efficiently transported to the surface. As a result, widespread wind gusts in excess of 50 mph occurred, with localized areas exceeding 65 to 70 mph. At some locations, wind gusts exceeded hurricane force (e.g., 85 mph near the Cleveland lakefront). A meteorological structure arguably similar to a type of sting-jet was present with the highest winds behind the dry cold frontal passage and dewpoint temperatures dropping significantly behind the cold front passage during the period of highest winds across Ohio and Pennsylvania. For a more detailed meteorological analysis, the National Weather Service Office in Cleveland, OH published an analysis available at weather.gov/cle/event_20260313_Wind.
This event provides an important case study for eastern U.S. utilities as they develop wildfire mitigation strategies with anticipated regulation. The dry post-frontal environment of this event increases the likelihood of wildfire ignition and creates conditions conducive to rapid, wind-driven fire propagation. The pre-green up timeframe of this event and ongoing drought across the western US likely contributed to an exceptionally dry environment.
The footprint of the high winds and outages extended from the Upper Midwest through the Great Lakes and into the Ohio Valley. However, the most severe impacts were concentrated along a corridor stretching from central Indiana through Ohio and into southern Michigan. A comparison of peak wind gusts and peak outage percentages (Figure 1) shows reasonable spatial correlation between the highest winds and outage impacts. Counties experiencing wind gusts from 60 to 70 mph consistently correspond to areas with elevated outage percentages, exceeding 20 to 40% of customers out at peak. The most significantly impacted counties saw outage percentages that exceeded 70% across Ohio.


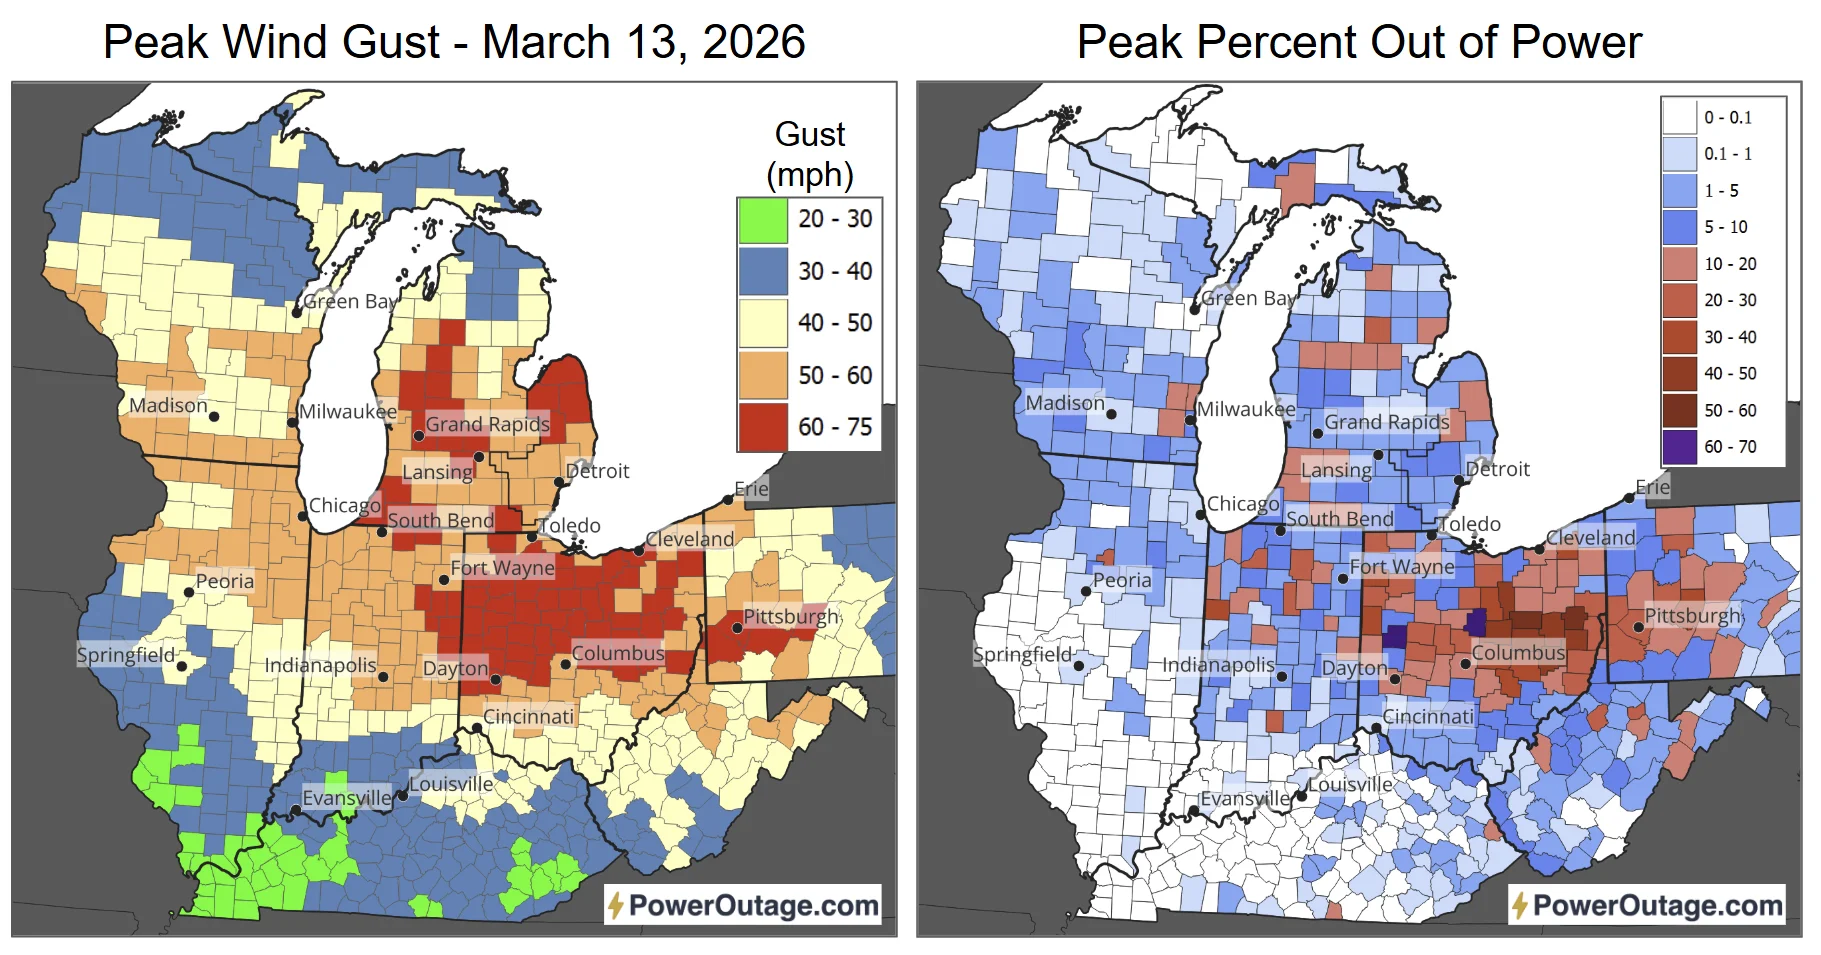
The spatial correlation between high winds and outage impacts reinforces a central finding: although wind intensity is the dominant driver, damage outcomes are strongly influenced by infrastructure characteristics, vegetation, and localized environmental conditions. Peak wind gust intensity alone explains approximately 50% of the variability in peak customer outages, underscoring the role of these additional drivers.
Relationship Between Wind Intensity and Probability of Outage Impacts
Power outage impacts are inherently probabilistic, reflecting the combined influence of infrastructure condition, vegetation exposure, and local environmental factors. From an engineering perspective, this behavior is well described by fragility relationships, in which the probability of component failure increases as wind loading intensifies. A comprehensive review of fragility concepts and how they can be considered for planning and operation is provided by EPRI (2025). This storm demonstrates how wind speed intensity can serve as a proxy for distribution system fragility, with impacts varying across the region as systems crossed from low-probability into high-probability failure regimes. For the purposes of this analysis, peak customers without power are interpreted as a proxy for the probability of outage occurrence across a given region (e.g., county level).
Figure 2 illustrates a clear and highly nonlinear relationship between wind intensity and outage severity. At lower wind classes (30–40 mph), outage impacts remain minimal, with a median of just 0.2% of customers affected at peak. Impacts increase modestly in the 41–50 mph range (1.1%) and begin to accelerate in the 51–60 mph range (3.8%). However, once wind gusts exceed 60 mph, outage severity rises sharply, with median impacts reaching 13.7% and high-end outcomes exceeding 40% of customers out. This pattern reflects a threshold-like response, where relatively small increases in wind speed produce disproportionately large increases in system damage. These results indicate that peak wind gusts of ~55 mph are over three times more likely to produce outages than gusts near 45 mph. This nonlinear increase is consistent with kinetic wind energy flux scaling with the cube of wind speed, resulting in a disproportionate rise in mechanical loading and system failures.
The box-and-whisker distributions (Figure 2) highlight the variability in outcomes as wind intensity increases. At lower wind speeds, outage impacts are more tightly clustered, indicating more consistent and limited system response. In contrast, the 61–70 mph class shows a wide spread between lower and upper percentiles, suggesting that local factors, such as vegetation density, infrastructure condition, and system design, play a much larger role once critical wind thresholds are exceeded. Outage impacts are not linearly related to wind speed, but instead are governed by threshold-driven processes that amplify damage beyond certain intensity levels.
Getting Smarter with Wind Risk: Introducing the Wind Intensity, Duration, and Coverage Framework
Peak wind gust intensity provides a useful first-order threshold for understanding potential impacts, but a more complete assessment requires incorporating additional dimensions, particularly the duration of high winds and their spatial coverage across a utility service area. High-intensity, long-duration wind events generally produce greater damage than short-duration peaks, while high-intensity, high-coverage events (e.g., hurricanes) drive more widespread impacts than localized high-intensity events (e.g., single-cell thunderstorms).
Figure 3 illustrates both the spatial distribution of peak wind gusts across Ohio and the proposed intensity–duration–coverage framework for interpreting storm severity. County-level observations show widespread gusts 60–70 mph across much of the state, with localized areas exceeding 70 mph, particularly in central and northern Ohio.
The intensity–duration–coverage table (Figure 3, right) provides additional context by quantifying how much of the state experienced high winds over time. While nearly all areas experienced at least 30–40 mph gusts for multiple hours, the footprint of higher-intensity winds narrows as thresholds increase. Winds exceeding 60 mph covered approximately 50% of the state for at least one hour, but this coverage drops sharply with duration, indicating that the most damaging winds, while widespread, were relatively short-lived. At lower wind thresholds, around 50 mph, the duration was relatively long-lived with at least 25% of the state experiencing a 50 mph gust for 6–8 hours.
This analysis demonstrates the value of combining spatial mapping with intensity–duration–coverage analytics to better understand storm impacts. While peak wind maps identify where the highest stresses occurred, the duration and coverage metrics provide critical insight into how long and how broadly wind loading stresses occurred. This multi-dimensional perspective is essential for explaining observed outage patterns, as widespread moderate-to-high winds sustained over several hours can drive significant system impacts, even in areas that did not experience the absolute highest gusts.
To illustrate the severity of high winds by duration, Figure 4 illustrates the accumulated time of wind gusts at or above 50 mph. This adds an important temporal dimension to overall wind impacts, helping to identify areas of elevated cumulative wind stress exposure. While peak gust maps identify where the strongest winds occurred, Figure 4 highlights how long damaging wind thresholds (e.g., 50 mph) were sustained. A broad swath from northern Indiana through central Ohio experienced multiple hours of ≥50 mph gusts, with localized areas reaching 6–8 hours of sustained high winds. This spatial variability in duration is critical, as it differentiates areas exposed to brief peak conditions from those subjected to long duration wind loading.
From an engineering and outage perspective, at any given location the duration of winds exceeding critical thresholds is a primary driver of cumulative system wind loading stress. Sustained wind loading increases the probability of progressive failures, as assets are subjected to repeated and prolonged mechanical strain. Vegetation that may tolerate short-duration gusts can fail under extended exposure, and infrastructure components can experience fatigue and degradation, leading to eventual component failure.
Prediction Challenges: Sensitivity to Wind Thresholds
One of the most significant challenges highlighted by this event is the difficulty of predicting outage impacts with precision, driven by the sensitivity of damage outcomes to small variations in wind speed near critical thresholds. Within the transition zone of approximately 50–60 mph, even modest forecast errors (on the order of 5 mph) can lead to dramatically different outcomes: winds of 45–50 mph may produce limited impacts, while gusts exceeding 60 mph can result in widespread and severe outages. This threshold-driven behavior introduces substantial uncertainty into outage impact forecasting.
Deterministic approaches are inherently limited in this regime, as they represent a single expected outcome rather than the full range of possible impacts. In reality, the relationship between wind speed and damage is probabilistic, with failure likelihood increasing rapidly as critical thresholds are approached and exceeded. This nonlinear response makes precise impact prediction particularly challenging.
The complexity of outage prediction is further compounded by additional factors, including vegetation characteristics, soil moisture conditions affecting root stability, and infrastructure design and condition. As a result, accurate forecasting requires not only high-quality meteorological inputs, but also a probabilistic framework that captures both atmospheric uncertainty and variability in system vulnerability. Ensemble-based approaches, ideally with hundreds of members and calibrated against historical events, are essential to representing this uncertainty and improving early detection of high-impact, low-visibility (“dark sky”) events.
Summary for Utilities and Regulators
This analysis has important implications for both utilities and regulators. For utilities, the results emphasize the need to move beyond peak wind forecasts alone and incorporate the duration and spatial extent of damaging winds into preparedness and storm planning. Anticipating not only how strong winds will be, but how long they will persist and how broadly they will affect the system, provides a more realistic basis for resource allocation and operational readiness. Calibrated wind-damage fragility curves, tailored to the characteristics of individual service territories, can further improve impact estimation and support more informed decision-making.
For regulators, the analysis highlights the importance of evaluating utility performance within the context of event severity. Traditional reliability metrics such as SAIDI and SAIFI, while valuable, do not fully account for differences in storm intensity, duration, and geographic exposure. Incorporating normalized severity metrics, based on integrated measures of intensity, duration, and coverage, enables more meaningful comparisons across events, utilities, and jurisdictions, helping to distinguish performance outcomes from underlying hazard conditions.
More broadly, the adoption of standardized geospatial frameworks offers a path toward greater transparency and consistency in both operational and regulatory contexts. By aligning data across utilities and events within a common spatial and analytical structure, these approaches support more objective benchmarking, improved situational awareness, and a stronger foundation for resilience planning.
Advancing data-driven and standardized frameworks for analyzing storm impacts will ultimately improve operational readiness, strengthen regulatory oversight, and contribute to a more resilient electric grid.
For further discussion of this analysis or to explore how OutageIQ can support your organization’s response, preparedness, and regulatory reporting, contact Matt Hope at matt@poweroutage.com.